
Technical SEO
Core Web Vitals and Ranking Drops: The Page Experience Factor
Slow, shifting pages lose close ranking contests. Here is how page experience signals work, how to read field data honestly, and what to fix first.
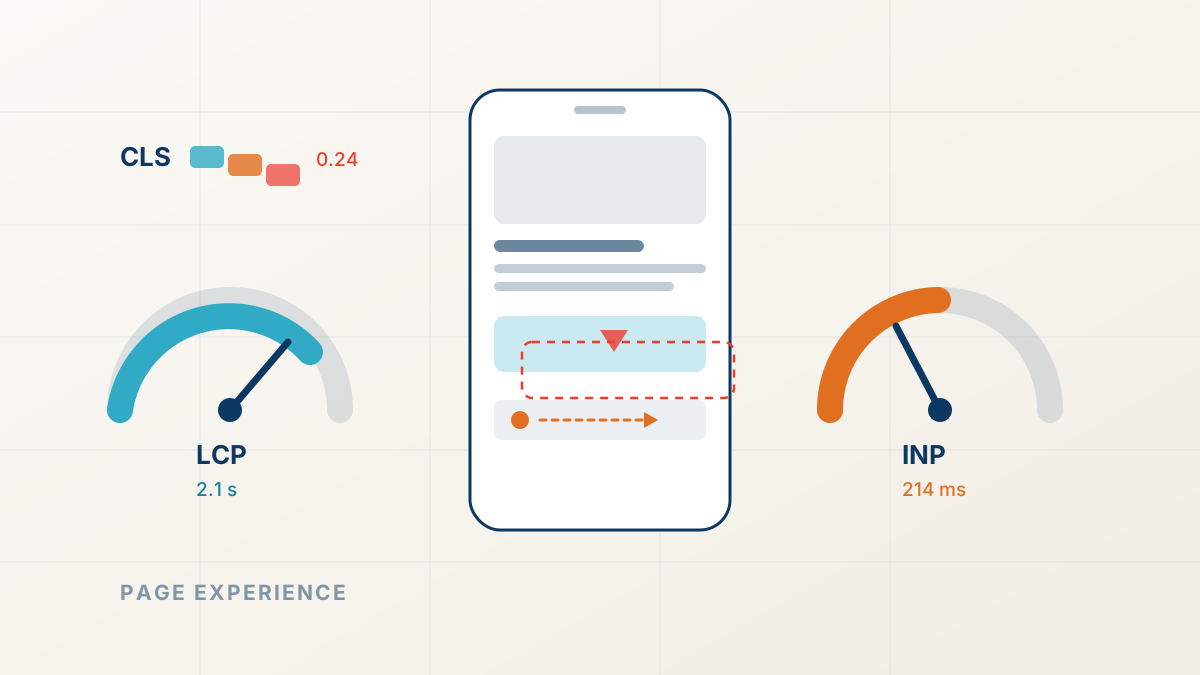
Key takeaways
- Page experience rarely causes a drop on its own; it decides close contests where content quality is otherwise even.
- The three Core Web Vitals thresholds are LCP under 2.5 seconds, INP under 200 milliseconds, and CLS under 0.1, measured on real users.
- Field data from real visitors — not lab scores — is what Google uses, and it lags your fixes by weeks.
- Fix experience at the template level and re-measure after every deploy, because regressions return with every release.
Experience decides close contests
Honest framing first: Core Web Vitals are rarely the only reason a page loses rankings. If your content is the best answer on the web, a slow page will still rank — it will just win with less margin than it should. Experience signals decide the close contests: the two pages with similar depth and authority, where one loads cleanly and the other makes mobile visitors wait through layout shifts.
That is exactly why experience shows up in ranking drops after redesigns and replatforms. A migration ships a heavier template, the vitals slip on every page at once, and pages that used to win tight contests start losing them. The content did not change, so the loss confuses everyone — until you check the timing against the release.
The three metrics that matter
Three measurements carry the page experience signal. Largest Contentful Paint (LCP) tracks loading: the moment the main content appears, which should happen within 2.5 seconds. Interaction to Next Paint (INP) tracks responsiveness: how quickly the page reacts when a visitor taps or clicks, which should stay under 200 milliseconds. Cumulative Layout Shift (CLS) tracks stability: how much the page jumps while loading, which should stay under 0.1.
The critical detail is where these numbers come from. Google uses field data — measurements from real Chrome users on real devices and networks, collected in the Chrome User Experience Report — not the score from a lab tool run on your laptop. A perfect Lighthouse score and a failing field report can describe the same page, because your lab test runs on fast hardware and your visitors do not.
CrUX field data is a rolling 28-day window. After you ship a fix, expect several weeks before the official numbers reflect it. Lab tests guide the fix; field data confirms it.
The mobile symptom pattern
The classic experience-driven drop announces itself on phones: mobile pages feel slow to load, buttons answer late, and sections jump as the page fills in. Desktop may look and feel fine, because the office connection and the powerful machine hide what the template does to a phone on a cellular network.
The usual suspects: heavy hero media served to every device. Third-party scripts fighting for the main thread. Fonts and layouts that push content down as they arrive. Sliders that delay the first meaningful paint. Each one is minor alone. Stacked on one template, they lose every close contest on mobile.
Read field data before lab tools
Before fixing anything, establish which templates actually fail for real users and when they started. Four checks produce that picture.
Check field data per template, not per site
CrUX and PageSpeed Insights report per URL. Your product template and your blog template can fail in completely different ways.
Segment mobile and desktop
Mobile failing while desktop passes is the signature of template bloat that real networks expose.
Line the regression up with deploys
Vitals that fell on a release date point to that release; a slow drift points to accumulated scripts and content growth.
Walk the worst template on a real phone
A mid-range device on cellular shows what field data records. Note what shifts, what lags, and what blocks the tap.
Fix the template, not just the page
Experience faults live in templates, so fixes belong there too. Compress and right-size hero media. Defer or remove third-party scripts. Reserve space for late-arriving elements to stop the shifts. Set a performance budget that a release cannot quietly exceed. Fixing one page in isolation repaints one room in a house with faulty wiring.
Then monitor, because experience debt returns with every release. Vitals tracking belongs in the deploy checklist next to indexation checks — our website maintenance service schedules exactly these verifications so regressions surface in days.
Finally, keep the loss in proportion. If field data passes and rankings still fell, experience was not the cause, and the budget belongs elsewhere. A ranking drop diagnosis weighs experience against the other five causes with dated evidence, so the fix list follows the finding.
Ranking Drop Diagnosis
Find out why your rankings dropped
FastestRank dates your traffic loss, ties it to a documented cause, and ranks the fixes — a human-reviewed diagnosis, not an automated checklist.
Sources
FastestRank Editorial
Ranking Recovery Desk
FastestRank Editorial dates and diagnoses ranking drops for business owners, separating verified causes from guesswork before any recovery work begins.
Continue Reading
Related Articles
Technical SEO
Technical SEO Errors That Remove Pages From Google
Pages keep returning 200 while quietly disappearing from search. Rogue canonicals, crawl blocks, and decaying redirect chains explain most of these silent losses.
FastestRank Editorial6 min read
Core Updates
Why Rankings Drop After Google Algorithm Updates
Traffic falls within days of a confirmed Google update. Here is how to date the drop, separate a site-wide loss from a page-level intent mismatch, and avoid the panicked fixes that slow recovery.
FastestRank Editorial6 min read

Technical SEO
The Comprehensive Guide to Modern SEO: Technical, On-Page, and Equity Foundations
A complete structural blueprint covering server infrastructure, semantic HTML, Core Web Vitals, entity-based keyword modeling, and authority acquisition.
FastestRank Editorial7 min read